LUNG CANCER PREDICTION USING LOGISTIC REGRESSION MODEL

Lung cancer is a type of cancer that begins in the lungs, it typically does not cause signs and symptoms in its earliest stages. The signs and symptoms occur mainly when the disease is advanced. The accuracy of the cancer prediction system enables the people to learn about their cancer risk at a minimal cost and it also enables them to make the best decision possible depending on the cancer risk status.
ABOUT PROJECT
In this project, I created an algorithm using logistic Regression model in python which makes prediction to enable people know their lung cancer risk status.
PYTHON LIBRARIES IMPORTATIONS
A library which is a collection of functions that we include in our python code and called as necessary. With libraries, pre-existing functions can be imported which will efficiently expand the code performance. For this project, I will import the following libraries pandas, numpy, matplotlib, seaborn, sklearn e.t.c. Then set %matplotlib inline since I’m using a Jupiter notebook

GETTING DATA
I worked with the Lung Cancer csv file which can accessed here. It has categorical Customer info, such as Gender, Lung_cancer. Then it also has numerical value columns:
• Age
• Smoking
• Yellow_fingers
• Anxiety
• Peer_pressure
• Chronic disease
• Fatigue
• Allergy
• Wheezing
• Alcohol consuming
• Coughing
• Shortness of breath
• Swallowing difficulty
• Chest pain
PROCEDURES
Procedures were taken, I will be discussing few of them one after the other.
1. Reading-in-the Lung cancer datasets
There are several methods to read in files. In this project I used pandas library. It allows you to read files with several delimiters.

2. The info() method
It returns the basic information about the Dataframe.

PERFORMING SOME EXPLORATORY DATA ANALYSIS (EDA)
Before I go into creating my Linear model and making the prediction accordingly. I did some exploratory data analysis on the data to further explore the data using visual techniques and check assumptions using graphical representations. I’ll only be using the numerical data of the csv file.
- Here, I used seaborn to create heatmap on the dataset to see if we have a missing data because checking for missing values and handling them properly is an important step in the data preparation process, if they are left untreated, they can:
- Lead to the behaviour between the variables not being analysed correctly.
- Lead to incorrect interpretation and inference from the data

2. Also created countplot with “YES” representing those with Lung cancer and “NO” representing those without Lung cancer, the reason is to visually understand between male and female which gender has the highest rate of cancer cases and as we can see below, the male gender has more cases of Lung cancer compared to the female.

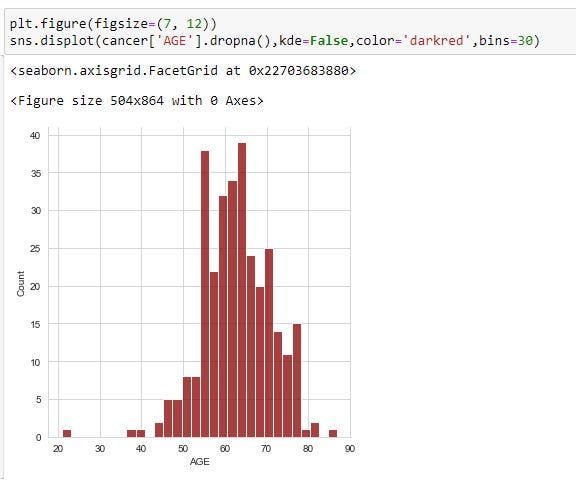
3. I also use seaborn to create a distplot of the age. With observations, it is normally distributed around 60yrs to 65yrs which means that we have more persons within that age bracket that are likely to have lung cancer.
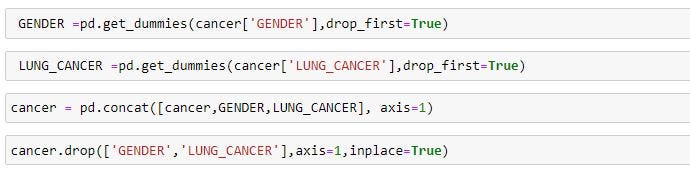
CONVERTING CATEGORICAL FEATURES
From our dataset, the “GENDER” and “LUNG_CANCER” column is made up of categorical features but since our model will be dealing with numerical features, I’ll need to convert categorical features to dummy variables using pandas! Otherwise, our machine learning algorithm won’t be able to directly take in those features as inputs.
BUILDING A LOGISTIC REGRESSION MODEL
Splitting data into training and testing set
After exploring the data, I went further to split the data into training and testing sets. I set a variable X equal to the other features of the dataset and a variable y which is the predicted variable equal to the "LUNG_CANCER" column. At this point, I imported the Sklearn model where I can Use the model_selection.train_test_split from sklearn to split the data into training and testing sets and set test_size=0.3 and random_state=101
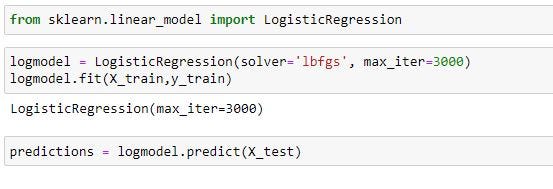
TRAINING AND PREDICTING THE MODEL
Recall that I made a split on the data into training and testing set, I will now train and predict the model on my training data. I further Imported LogisticRegression from sklearn.linear_model and Create an instance of a LogisticRegression() model named logmodel.
We can see that our model is actually doing well. Now let us move forward to evaluating the model
EVALUATING THE LOGISTIC REGRESSION MODEL
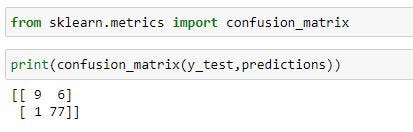
CONFUSION MATRIX
It is the table that helps to access where error is in the model, usually in classification problems. The rows stand in for the actual classes the outcome should have been. While the columns represent the predictions we have made. Using this table, it is very easy to determine which predictions are wrong.
RESULTS EXPLANATION
True from the above results means that the prediction of the model is accurate while False indicates wrong prediction on the model or we can say there was an error on the prediction.

True Negative (Top-Left) – The case was negative and predicted negative False Positive (Top-Right) – The case was negative but predicted positive False Negative (Bottom-Left) – The case was positive but predicted Negative True Positive (Bottom-Right) – The case positive and predicted positive
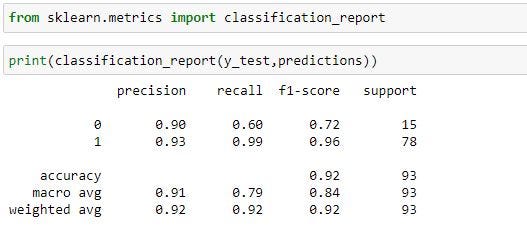
CLASSIFICATION REPORT
Since we have successfully made our confusion matrix, we will be using classification report to check for precision, recall, f1-score so as to quantify the quality of our model.
RESULTS EXPLANATION
Precision
It tends to measure the positive predicted values to know which percentage is truly positive. It does not measure the correctly predicted negative outcome.
True Positive / (True Positive + False Positive)
Recall (Sensitivity)
It measures how good the model is at predicting positives. This means it looks at true positives and false negatives (which are positives that have been incorrectly predicted as negative). Recall is good at understanding how well the model predicts something is positive.
True Positive / (True Positive + False Negative)
F1-Score
It represents the harmonic mean of precision and recall. It tends to consider both false positive and false negative cases and can be use to detect imbalanced dataset. It does not take into consideration the true negative values.
2*((precision * Recall) / (Precision + Recall))
Thanks for going through my project, your observations and suggestions are highly appreciated, you can leave your inputs in the comment session, email me directly here or reach me through other of my social media platforms below.

